
The Dutch were slow to settle New Netherland. The Dutch West India Company (WIC), which sponsored the colony, was chartered by the States General in 1621, and granted a trade monopoly. The company was primarily interested in fur trading, and settlement was not at first a priority. Only in 1624, did it send the first permanent settlers to the new province—prompted in part by the realization that an unpopulated colony was vulnerable to seizure by the English or the French. The role of the new settlers was primarily to raise food and engage in other activities in support of the company’s commercial enterprises. Shortly thereafter, in 1626, Peter Minuit made his famous purchase of Manhattan from the Indians. Nonetheless, the population grew very slowly. Estimates vary, but in 1628 the population of New Netherland was somewhere between 300 and 500. It increased somewhat in the 1630s, but then dropped again as a result of the destruction caused by Director-General Kieft’s Indian wars. Historian Michael Kammen estimates the population in 1640 as about 500; Oliver Rink estimates 2,500 in 1645, and no more than nine thousand in 1664.
The slow development of what was little more than a trading post helps explain why it was not until 1630 that the Dutch published the first reasonably detailed map of New Netherland. This map, which bears the title Nova Anglia, Novum Belgium et Virginia, was engraved by Hessel Gerritsz for publication in the second edition of Johannes De Laet’s The New World The intellectual content of this map was provided by De Laet, who is an important figure in the history of New Netherland. De Laet was an accomplished historian, and an important publicist for Dutch colonization. In addition, he was one of the directors of the Dutch West India Company, and had a major financial stake in the new colony. He is a major source for the early history of New Netherland, and particularly for its cartographic history. De Laet had access to the archives of the West India Company, including the two “figurative maps” discussed in the previous chapter. In his book he gives an account of Block’s voyage around Long Island, which provides important information about some of the place names that appear on the Block Chart.
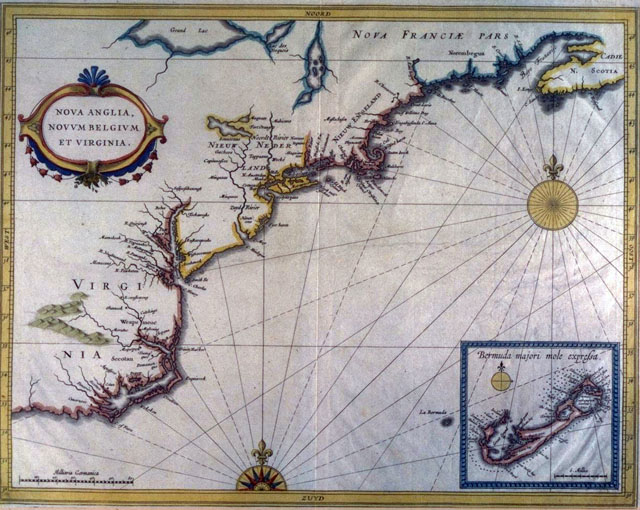 Johannes De Laet, Nova Anglia, Novum Belgium et Virginia (1630). Courtesy of the Osher Map Library, University of Southern Maine.
The depiction of New Netherland on the De Laet map is basically a synthesis of information from the two figurative maps, although it also relied on English and French sources for areas north of Cape Cod and South of Delaware Bay. The boundaries of New Netherland, although never unchallenged by the English, extended from the Connecticut River to the Delaware River. In their more imperialistic moods, the Dutch also laid claim to Cape Cod, and to lands as far north as the St. Lawrence River, although they never made a serious effort to gain control of these areas. In comparison with subsequent printed maps, the De Laet map is relatively modest in the claims it makes for the boundaries of New Netherland.
The De Laet map provides a good overview of New Netherland in its embryonic form. Long Island is shown split into three parts by waterways. This is a carry over from the Block Chart, where these channels also appear, although less distinctly. It has been surmised that Block, in sailing around Long Island, caught sight of the deep estuaries on the North Shore and the breaks in the barrier beach of the South Shore, and that (connecting the dots, so to speak) he imagined that they ran clear through the island.. Long Island itself is labeled “Matowacs,” a name that is probably connected with the Montauk Indians, and which can be found on maps of Long Island throughout the colonial period. This name replaces “Nahicans” on the Block Chart, which reinforces the suspicion that it was transferred from the mainland to Long Island on the Block Chart as a result of an error by a copyist. “Nahicans” was the Dutch word for Narragansett, and appears on the mainland in later Dutch maps.At the tip of Long Island, Montauk Point is labeled “Hoek van Visschers” (Fishers’ Point). As De Laet explained in the text of the first edition of his book, this name was assigned by Block himself on account of the native fishermen he saw As on the original Block Chart, Block Island is labeled “Ad. Block Eyland.”
The area of the Hudson and Delaware Rivers on the De Laet map is a close copy of the second figurative map of Cornelis Hendricksen (discussed in the previous chapter), although it is simplified and some names are added. The connection between these two maps is not very surprising, since Hessel Geritsz is now thought to have been involved in the preparation of both. As one would expect, the two Dutch settlements founded in the 1620s, New Amsterdam and Fort Orange, appear on De Laet’s map. Fort Orange, on the site of what later became Albany, had by this time replaced Fort Nassau, which had been damaged by a flood and abandoned. Hell Gate (Helle gat, “bright passage”) also appears on this map, as do the names of several Indian Tribes along the Hudson and Delaware Rivers. The Hudson River bears the name Noordt Rivier (North River), which was long used as a synonym for the Hudson River on navigation charts. Many of the Dutch names for features along the Hudson River, which appear on the Hendricksen chart, are missing on De Laet’s map—they were probably omitted because of its smaller scale. The Delaware River appears as the South River (Zuyd Rivier), and the Connecticut River as the Fresh River (Varsche Rivier). Both of these names were used throughout the Dutch period.
De Laet’s treatment of the lakes and rivers of northern New York is peculiar and interesting. As on the Hendricksen chart, the Mohawk Indians are placed near their eponymous river, but the Mohawk River is still not shown joining the Hudson. Instead, it is depicted as flowing into what is probably a wildly displaced Lake Oneida, which in turn drains into the Delaware River. The watershed of the upper Susquehanna River is not shown, and the upper reaches of the Delaware seem to include some of the tributaries of the Susquehanna. The name “Sennecaas” again appears directly under Lake Oneida, although the Senecas lived far to the west. To the north, Lake Ontario is shown, labeled in French (betraying the source of this information) “Grand Lac.” What appears to be a second Lake Oneida (“Lac des Yroquois”), which is derived from Champlain’s maps, is shown flowing into Lake Ontario. The relationship between these bodies of water and the St. Lawrence River is obscured by the frame of the map. The biggest surprise on this part of the map is the treatment of Lake Champlain, which resembles that on Champlain’s map of 1612, but is considerably improved. On De Laet’s map, the lake is more correctly oriented in a north-south direction, and what appears to be Lake George is more sharply differentiated from Lake Champlain. The lakes are also correctly located much closer to the Hudson River than on other Dutch maps, including those produced decades later. There are no records of the Dutch having visited either Lake George or Lake Champlain, although Dutch fur traders could well have made one or more unrecorded trips to the area. It is also possible that De Laet’s information about these bodies of water came from Indian sources. In any case, the depiction of Lake Champlain on De Laet’s map is better than on any other map, either Dutch or French, produced prior to the 1660s.
The next important Dutch map of New Netherland is Willem Janszoon Blaeu’s Nova Belgica et Anglia Nova, which appeared in 1635 Blaeu was one of the most prominent Dutch map makers of the seventeenth century, and benefited from close ties with the West India Company.
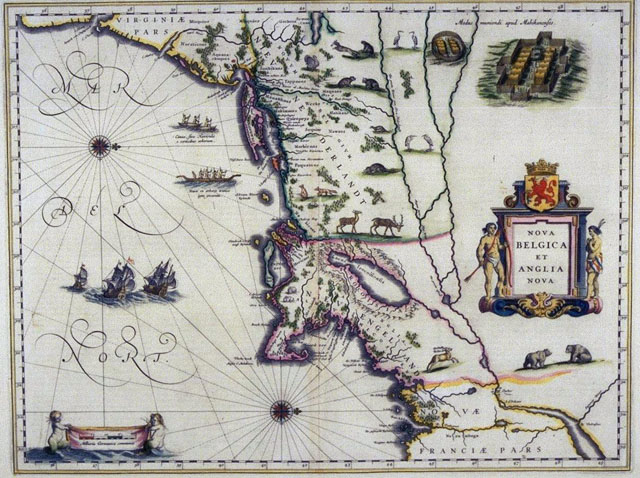 Willem Janszoon Blaeu, Nova Belgica et Anglia Nova (1635). John Carter Brown Library at Brown University.
Before describing Blaeu’s map, it should be mentioned that there is some lack of agreement among scholars as to why the name Nova Belgica (New Belgium) appears so often on Dutch maps of New Netherland. The correct explanation is that there is no Latin equivalent of “New Netherland,” and that Nova Belgica was its closest Latin approximation. It is also true that many of the settlers of New Netherland were French-speaking Walloons, who were Protestant refugees from Spanish rule in the area that later became known as Belgium. It has occasionally been maintained that the name was adopted in their honor. There is no documentary evidence for this, and in the seventeenth century the name Belgium was applied to both the southern and the northern provinces of the Netherlands (in 1648 the northern provinces were known officially as Belgium Foederatum and the southern provinces as Belgium Regium). Belgium only became established as the name of a country separate from the Netherlands in 1839. Thus, it appears clear that on seventeenth-century maps the name Nova Belgica had no special meaning other than being the Latin equivalent of New Netherland.This is confirmed by the usage on the Blaeu map, where names are often given in both Dutch and Latin—e.g. Niev Nederland and Novvum Belgivm or Niew Engeland and Nova Anglia.
The Blaeu map, which is a personal favorite of mine, used much the same sources as the De Laet map, but the two differ significantly in details. In many respects, Blaeu’s map follows the Block chart more closely than the De Laet map. This is particularly evident on the northern portions of the map, in which the depictions of the St. Lawrence River and Lake Champlain are almost identical to those on the Block chart. On both maps, the upper St. Lawrence River is labeled Die Groote Rivier van Nieu Nederland (The Great River of New Netherland) , and Lake Champlain is displaced far to the east. The coastline of Long Island and southern New England is also modeled very closely on the Block Chart. However, Blaeu added an updated depiction of the Delaware River, which very closely follows De Laet. Most of De Laet’s place names are also on the Blaeu map, along with some additional names.
The Blaeu map is also notable for its fine engraving, and its extensive and attractive iconography, which make it popular with collectors. Its drawings of Natives and wildlife were widely copied in the seventeenth century, and many of its other features appear on later maps. As progenitors of numerous cartographic offspring, such maps are sometimes called “mother maps” by specialists in the history of cartography.
The animals and Native Americans on the Blaeu map were not purely decorative, although they had a decorative function: the paintings of seventeenth-century Dutch masters, particularly Vermeer, frequently show such maps on the walls of homes. These drawings were also serious efforts to inform map users of conditions in the newly discovered lands. There are no fanciful unicorns or dragons here. The Blaeu map tried, by and large successfully, to depict the typical native animals of what was to become the northeastern United States. In addition to showing such widely distributed species as rabbits and bears, the map depicts such characteristic North American animals as otter, elk (wapiti), beaver, and turkey.[11]
The accuracy of the depiction of Native Americans on the Blaeu map is more open to question. The couple on each side of the cartouche look suspiciously like European models dressed as fanciful Indians. More realistic are the drawings of boats in the ocean to the south side of Long Island. These are labeled (in Latin) “canoe, or little boat made from the bark of trees” and “boat made from a tree trunk hollowed out by fire.” Birch bark canoes would probably not have been used along the coast, although they were found on the inland waters of what is now upstate New York. Large log canoes were, however, regularly used by Natives in the ocean off Long Island for communication with the mainland and even for whaling. These paddling Indians closely resemble those that appear in the earliest view of New York, which has been dated 1626-28.[12] The two palisaded Indian villages labeled “manner of dwelling among the Mohegans” have caused considerable controversy among archaeologists. The houses in the villages are fairly good representations of Indian long houses, but the neat rectangular shape of the larger village does not appear to be historically accurate. The smaller round village labeled resembles what is known of actual Indian villages more closely, although many Indian settlements were not fortified at all. At best, both drawings are highly idealized, as one would expect, since they were made by engravers in Europe who had never seen an Indian village. The artists might or might not have been working from crude sketches and written descriptions brought back by explorers or traders. Many of the illustrations on the Blaeu map can be shown to have been copied from other sources. These methods of compilation left much room in which the imagination could frolic, and such illustrations should be used with caution.
By the early1640s, the Dutch West India Company realized that it would have to attract more settlers if the colony was to survive. New Netherland lost much of its small population between 1639 and 1645 in a disastrous Indian war under Director-General Willem Kieft. The Dutch colony was also rapidly being overshadowed by the rival English settlements in New England and Virginia. After 1647, the colony’s new director-general, Peter Stuyvesant, made considerable efforts to bring in settlers and help them to get started. His efforts met with some success, but even at the end of Dutch rule, in 1664, the population of New Netherland was only about 9000, including some 2000 English-speaking settlers on Long Island. At the time of the fall of New Amsterdam, the population of New England was around 50,000. The disproportion between these numbers made the eventual fall of New Netherland all but inevitable.[13]
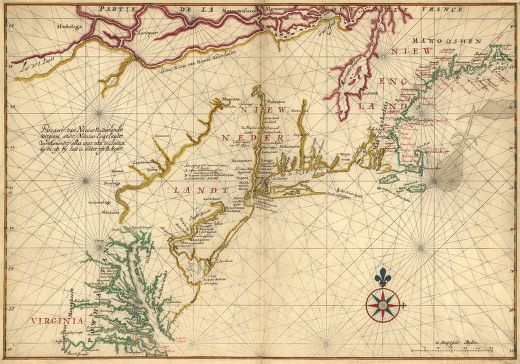
The landmark map for this later period of New Netherland is the famous Jansson-Visscher map, which was reprinted with minor changes at least 31 times between 1650 and the middle of the eighteenth century (Figure 2.3).[14] The earliest map in this series was published by Jan Jansson, and usually dated 1651, although it is now thought to have appeared in 1650.[15] Recent research has shown that this map is based on a manuscript drawn for Adriaen Van der Donck, probably by Augustin Herman (or Hermann).[16] Van der Donck was an important figure in the political life of New Netherland, as well as the author of a Description of New Netherland (1655), which is an important source for the history of the period. Van der Donck is more than anyone else responsible for the intellectual content of the map, which makes his role is remarkably similar to that of de Laet vis à vis the Garritz/de Laet map. Augustin Herman himself is an interesting person. An associate Van der Donck, he was official surveyor of New Netherland, and apparently the first Czech immigrant to America. He later went on to acquire a large grant of land in Maryland, and drew an early (1670) map of Virginia and Maryland. Probably we should now speak of the Van der Donck/Herman/Jansson/Visscher series of maps, but I will continue to follow general usage and refer to it as the Jansson-Visscher series. All of the maps in this series are very similar, and most of the features I will be describing appear on all of the versions of the map. The most important changes in the later maps in this series are the addition of new settlements, such as Philadelphia, and of place name changes, including the change from New Amsterdam to New York. When a feature is confined to only part of the series
The famous Jansson-Visscher maps reveal much about New Netherland towards the end of Dutch rule. By this time the Dutch had a reasonably good knowledge of the geography of their domain. The major rivers and their tributaries are clearly shown. The Catskill Mountains and the Hudson Highlands are sketched in. Some fortifications, and various Dutch and English towns are depicted. Characteristically, boundaries are not shown, and only two large land holdings are named (Rensselaerswyck and the abortive “Colonie van de Heer Nederhorst”). Instead, numerous Indian villages and tribal names are given, which makes this map an important resource for students of Native Americans in the Northeast. Since the fur trade remained vital to the economy of New Netherland, it was important for the Dutch to know who their Native customers were, and where they were to be found.
Remarkably, the overall framework of this map is still based, directly or indirectly, to a large extent on the two figurative maps. This is particularly evident in the treatment of northern New York, which is clearly derived from the Block chart via the Blaeu map. The depiction of the St. Lawrence River is little changed from the Block Chart, and it is still labeled “De Groote Rivier van Nieu Nederlandt.” There is scarcely a hint of the Great Lakes, and Lake Champlain is still displaced to the east of the Connecticut River. There is no indication on this map of the important trade route between Albany and Montreal via Lake George, Lake Champlain, and the Richelieu River. Lake Oneida, which was badly misplaced on previous maps, disappears completely from the vicinity of the headwaters of the Mohawk River. There remains a small lake flowing into the St. Lawrence far to the west that may or may not represent Lake Oneida. The Seneca and other Iroquois tribes are still shown living in the vicinity of the headwaters of the Susquehanna River. All of this indicates the extent to which the rulers of New Netherland were focused on water born trade supplemented by some farming along the Hudson River and Long Island. No real effort was made to explore the hinterland and build up a land-based empire, in spite of their extravagant territorial claims.
Dutch map makers were not shy about borrowing from each other. The Janszoon-Visscher maps lifted most of their iconography from the Blaeu map. Blaeu’s whole menagerie of animals is here, as well as the two palisaded Indian villages. There is an interesting change in the way the villages are labeled in some of the later maps in this series, which may be of interest to archaeologists and anthropologists. On the Blaeu map, both villages were labeled “manner of living of the Mohegans.” On the third state of the Visscher version, that description applies only to the larger rectangular village. The round village is labeled “another manner that of the Minnesinks.”
The most significant feature in the iconography of the series is the inclusion in most versions of a view of Manhattan. The best known of these views appeared for the first time in the earliest edition published by Visscher, usually dated ca. 1655, but possibly produced as early as 1650. This view has been shown to be based on a drawing by Van der Donck recently discovered in the Austrian national archives. In some versions of the map issued after the Dutch recapture of New York from the English in 1673, this view is replaced by another view of Manhattan, known as the “restitutio” view, which shows the growth of the city in the intervening years. These views will be discussed in greater detail in the final section of this chapter.
The Jansson-Visscher maps make their most important contribution in depicting the areas between the Connecticut and Delaware rivers, particularly along the Hudson River and on Long Island. These are the areas in which there was a strong Dutch presence, and it is possibly significant that in the versions of the map that were printed in Van der Donck’s book, it was cut down to show only these areas. This is the part of New Netherland that Van der Donck and other members of the Dutch elite knew at first hand.
The depiction of Long Island is in most respects greatly improved from previous maps. The island is now assembled in one piece instead of broken up by channels, although the name Gebroken Landt is retained to the west of Hempstead. Long Island is now labeled “t’Lange Eylandt alias Matouwacs.” A number of Dutch and English town names appear on Long Island. The Dutch place names on western Long Island include Brooklyn (Breukelen), Maspeth (Mispat), Amersfort, and Flushing (Vlissingen). Named English settlements include Jamaica, Greenwich (Greenwyck), Gravesend (Gavesant), Hempstead (Heemstee), Southold (S. Holt), East Hampton (Hampton), and Gardiner’s Island (Garners Eylant). Other features on Long Island in this map series I have discussed elsewhere.[17]
The Hudson Valley region is likewise sprinkled with familiar features and names. The Hudson Highlands and the Catskill Mountains are clearly sketched in. Although there were still practically no Dutch settlements between Manhattan and Fort Orange (Albany), numerous creeks and other features bear names that can still be found (often with some variation in spelling) on modern maps These include Catskill or Cat Creek (Kats Kill), the Esopus River, Wappinger Creek, Rensselaerswyck, Kinderhoek, and Roeloff Jansoons Kill. The Mohawk River is shown, including on later editions the settlement of Schenectady. Numerous Indian tribes and village sites are shown along both the Mohawk and the Hudson Rivers, as well as in New Jersey. There are so many of them that they seem to overshadow the Dutch settlements, and they constitute a valuable resource for anyone interested in Indian settlement patterns.
The Jansson-Visscher maps are the only general purpose maps of New Netherland that make an attempt to give some idea of where people actually lived. Dutch and English villages, individual farms, and a few Indian settlements are marked by symbols resembling tiny houses with pitched roofs and chimneys. A few settlements are also indicated by hollow circles, which may show proposed settlements. Individual farms along the Hudson River are sometimes depicted with one of these house symbols, accompanied by a square symbol, which might indicate one or more outbuildings. Some attempt is made to show the size of settlements by repeating these symbols. (Hempstead, for example, has eight of them.) Nobody appears to have attempted a detailed analysis of these symbols, which might repay additional work. As things now stand, it is often unclear whether individual symbols are meant to indicate Indian or European or settlements, and to what extent they can be relied upon to represent the actual number of houses at a particular location. Nonetheless, they are valuable for giving us some idea of the distribution of settlements in New Netherland around 1650. In a nutshell, the land was practically uninhabited by Europeans, except on Manhattan, Long Island, and in the immediate vicinity of Fort Orange.
The Jansson-Visscher maps contain a few remarkable errors or omissions. There is no indication of the barrier beach on the south shore of Long Island, or of the Great South Bay, although they are mentioned in contemporary written sources. Thus, Adrian Van de Donck, whose role in the creation of this map has been noted, wrote: “Along the seacoast of Long Island there are also several safe, commodious inlets for small vessels, which are not much frequented by us. There are also many spacious inland bays, from which, by the inlets (at full tide), the sea is easy of access; otherwise those are too shallow.”[18] Another striking mistake is that the Delaware River is erroneously shown joining the Hudson River. This error is corrected on some later maps in the series. This may be another example of misapplication of information obtained from the Indians, who traveled from the Delaware River to the Hudson River via the Walkill River with the aid of portages (this was later the route of the Delaware and Hudson canal). Another error in the course of the Delaware was to underlie a land dispute between New York and New Jersey, which listed until nearly the time of the American Revolution, and will be discussed in subsequent chapters. Many of these errors result from the map having been engraved in Amsterdam, and serve as reminders that people who actually lived in New Netherland may have known more about their surroundings than appears on maps.
The Dutch maps in this series still reflect the expansive Dutch claims to control the entire region between the Delaware and Connecticut Rivers, and even applies Dutch names as far up the coast as Cape Cod. Recently a good deal of attention has been paid to the propagandistic aspects of Dutch and English colonial maps of the seventeenth century.[19] There can be no doubt that the Dutch, like the English and the French, fortified their claims to vast areas of land by renaming them in their own language. The name “New Netherland,” itself, plastered over thousands of square miles of forests unexplored by Europeans, is an extreme example of this practice. I doubt that this war of names had very much practical impact either on the Indians, who were thus on paper made subjects of the Dutch, or on other European powers, which were more concerned about actual settlement and military power than with names on maps. Although the maps did succeed in irritating the English, they did nothing to prevent the eventual English takeover of New Netherland. However, these maps would have had considerable effect in the Netherlands. Maps like those in the Jansson-Visscher series were often published with books describing the new colony, or hung on the walls of merchants and statesmen. The familiar names would have helped to persuade settlers that “New Netherland” would have been a good place to call home, and served to convince investors or politicians to support the infant colony. As is the case with most propaganda maps, they seem to have been most effective at home. It may also be that the widespread use of this map help ensure the continued use of many Dutch place names in New York and as far south as the mouth of the Delaware River, where we can still find Cap May (named after Captain Cornelius Mey) and Cape Hinlopen (now Henlopen).
In spite of their errors, omissions, and propagandistic distortions, the Jansson-Visscher maps were reasonably accurate for their time and place, and are rightly considered to be among the finest products of the golden age of Dutch cartography. Because of their intended audience of statesmen and merchants, they were of limited practical use to navigators or administrators in New Netherland. These users needed more detailed and specialized maps. For example, one would not want to sail into New York Harbor and up the Hudson River using one of the Jansson-Visscher maps. For this purpose one would need a more detailed nautical chart, and these were also supplied by Dutch cartographers The Dutch trading empire depended on shipping, and consequently it should come as no surprise that many of the most important maps of New Netherland are nautical charts. It is not always possible to distinguish nautical charts from general reference maps. Even a regional map like the Jansoon-Visscher map could be of some use to the captain a ship. It provides a general outline of the coast, and even includes some shoals and soundings in New York Harbor and the mouth of the Delaware River. Viewed in this broad sense, the two figurative maps could be considered the first nautical charts of New Netherland. The second figurative map (the Cornelis Hendricksen map) even includes named “reaches” on the Hudson River. (A reach is a length that can be sailed without tacking when the wind is coming from one direction.)
Maps that are primarily intended to serve as nautical charts are quite distinctive. They focus on such things as soundings, shoals, channels, islands, and landmarks, which can help a sailor ascertain his position and avoid hazards. Other information is minimized—particularly most details on the shore other than such things as hills or mountains that might serve navigators as landmarks. In the seventeenth century, most nautical charts also featured elaborate patterns of “rhumb lines.” Rhumb lines, which usually coincide with compass points, were intended to aid navigators in following a course in a particular direction.
The first true nautical charts of New Netherland are two anonymous manuscript maps drawn around 1630. Both are in the Harrisse Collection at the Library of Congress. The more general of the two charts (Figure 2.4) bears the title Pascaert van Nieuw Nederlandt Virginia, ende Nieuw-Engelandt… (Chart of New Netherland, Virginia and New England…)Although a black-and-white copy was reproduced by Stokes, not much attention has been paid to this map. A high- resolution color image of the chart has recently been made available by the Library of Congress as part of its project The Atlantic World: America and the Netherlands. At first sight, the chart looks a good deal like the Gerritsz/De Laet map of 1630, which is its primary source, but a close examination shows significant differences. As one would expect on a nautical chart, it has rhumb lines, and it depicts shoals, rocks, and other features not found on the de Laet map. For a nautical chart, it shows an unusually large number of inland place names, including those of many Indian tribes. It improves in several ways on earlier maps of New Netherland. Long Island is shown in one piece, although it is distorted in a peculiar way. Many English place names are shown in red ink (other names are in black). There are major improvements in the way the Delaware and Susquehanna rivers are depicted, although the Mohawk River is still not shown as connecting to the Hudson. The misplaced Lake Oneida on the de Laet map is removed from this map. The picture of area around the St. Lawrence River is closer to that on the Blaeu map than it is to that on the de Laet map, and Lake Ontario is shown (labeled Lac de S. Louis, as on Champlain’s maps). In spite of the improvements, Manhattan is still shown as a squat triangle, which is barely detached from the mainland. In short, this chart presents a rather odd mixture of improvements and errors, which will likely make it the subject of much discussion now that it has been made more widely available.
Joan Vinckeboons, Pascaert van Nieuw Nederlandt (1639?). Library of Congress, Geography and Map Division.
The second chart in the Harrisse collection (Figure 2.5) bears the title Noort Rivier in Niew Neerlandt (The North River in New Netherland). This map was probably prepared for Peter Minuit around 1630, and is sometimes known as the Minuit Chart. I will refer to it as the North River chart (the Dutch usually called the Hudson River the North River). It is a remarkably detailed and carefully drawn map. In addition to showing the “reaches” along the Hudson, it provides a careful depiction of shoals, islands, headlands, and soundings in the river. These are accurate enough to provide useful information to anyone interested in tracing changes in the configuration of the river. It has been claimed that this is actually the first map to show a continuous line of soundings in a river As one would expect from a nautical chart, it provides little information about features on the land, although landmarks useful to sailors, such as the Catskill Mountains and the Hudson Highlands, are shown. It includes the names of several Indian tribes, but these can also be found on other maps. Nonetheless, like other Dutch nautical charts of this period, it does occasionally provide bits of information that cannot be found elsewhere. Shirley Dunn has pointed out that two Mohican villages on this chart were labeled “vasticheyt,” indicating that they were palisaded. The North River chart also provides limited amounts of information about the types of vegetation on individual islands in the Hudson River.
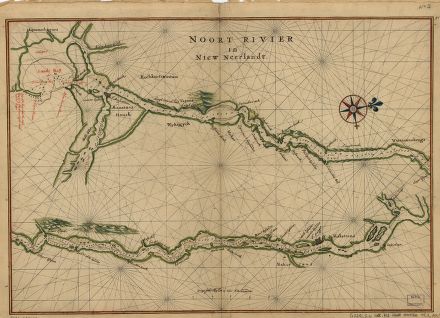
Joan Vinckeboons, Noort Rivier in Niew Neerlandt (1639?). Library of Congress, Geography and Map Division.
The history of printed nautical charts of New Netherland is particularly difficult to disentangle. Many of the published charts appeared in atlases, and clearly depict conditions a number of years prior to their actual date of publication. In some cases these maps may have been issued separately long before their appearance in an atlas, and without any date on the map. In other cases, the maps may have existed as manuscripts for years before their publication. Many of these charts were republished several times, sometimes without change, and sometimes with major or minor revisions. It is therefore difficult to construct a precise chronology of the published nautical charts.
The earliest published nautical charts of New Netherland were basically adaptations of previously published general-purpose maps. The first printed nautical chart of New Netherland is now thought to be Jacobs Theunis’ Pascaerte van Nieu Nederlandt, Virginies, Niewu Engelant, en Nova Freancia, van C. of Faire tot C. Forchu (ca. 1650). It is based on a 1636 map of New Netherland by Jansson, which is very similar to the De Laet map, and not separately discussed in this book. The Theunis chart follows its prototype closely, but bears the typical appearance of a nautical chart, including a dazzling display of rhumb lines and a picturesque drawing of a Dutch sailor preparing to take a sounding.
Until Burden established the priority of the Theunis chart, the earliest printed nautical chart of New Netherland was thought to have been published by Arnold Colom in 1656 This chart exists in several states, with later editions being published by Hendrick Doncker. Doncker was another map maker with close ties to the West India Company, and he published the chart in an atlas called The Sea-Atlas, or the Water-World. Bearing the title Pas caarte van Nieu Nederlandt(Chart of New Netherland), this map covers the whole area from Cape Cod to Cape Hatteras. Although it has the typical appearance of a nautical chart, it appears to be an adaptation of the coastal features from the Jansson-Visscher series. It contains little additional information, and it is not especially accurate. For what it is worth, it does seem to be the first map of New Netherland to include the place name Oyster Bay, but overall one would do at least as well using the Jansson-Visscher map for navigational purposes as the Colom chart, even though the latter was sold specifically as a nautical chart.
The Colom chart was followed by a similar, but somewhat improved, chart by Johannes Van Loon in 1661. The next printed charts of New Netherland appear to be a pair published by Pieter Goos in a sea atlas in 1666. The first of these covers the area from Cape Cod to Cap Hatteras, and appears to be identical with Van Loon’s chart of the same area. ).The Van Loon/Goos charts are noteworthy mainly for the additional information they provides about shoals, particularly around the entrance to New York Harbor, and for showing the rocks in the East River at Hell Gate. They show Jamaica Bay as being much more open than in more recent times—apparently there was only a shoal in the seventeenth century where there is now a barrier beach. Like many Dutch maps of this period, they sport handsome engravings of sailing ships approaching New York Harbor. Ocean going ships were the jet aircraft or space shuttles of their day: they were both the primary tools and the symbols of Dutch maritime power. Their frequent appearance on maps is not only decorative, but also served to celebrate and assert the might and glory of the Dutch republic.
The other chart in Goos’s sea atlas is more original and innovative. It covers the coastline from Delaware Bay to the western part of Long Island, and it is more detailed and larger in scale than its companion chart. It includes extensive soundings and carefully delineates shoals in the mouth of the Delaware River and in New York Harbor. This chart is most noteworthy for its depiction of the Delaware River and New Jersey, but it is also of interest for what it shows about the New York harbor area and western Long Island. Manhattan and the East River are depicted much more correctly that on previous maps, and this chart provides a picture of the western Long Island coastline that differs somewhat from that shown on the previously discussed chart in the same atlas. Coney Island (Knynen Eylandt) is shown as still an island detached (just barely) from the mainland. Jamaica Bay is labeled Rechkewach (Rockaway), and is given a different configuration than on the previous chart, although it is still not shown as being fronted by a barrier beach. This second chart, which marks an important advance in the mapping of the New York area, gives the impression of having been created later than its companion chart.
The next nautical chart of New Netherland to be published appears to be Arent Roggeveen’s 1675 Pascarte van Nieu Nederland streckende vande Zuydt Revier tot Hendrick Christians Eylandt (Figure 2.6). This chart is very different from its predecessors, and appears to be compiled from materials gathered in the 1650s or 1660s. Roggeveen obtained permission to publish a sea atlas called The Burning Fen in 1668, but the earliest known edition of the atlas using Roggeveen’s plates was published by Goos in 1675. It is possible that an earlier edition of this atlas was published, or that some of the maps were published individually. A later edition by Jacob Robijn appeared in 1685.[32]
Detail of Arent Roggeveen, Pascarte van Nieu Nederland streckende vande Zuydt Revier tot Hendrick Christians Eylandt (1675). Library of Congress, Geography and Map Division.
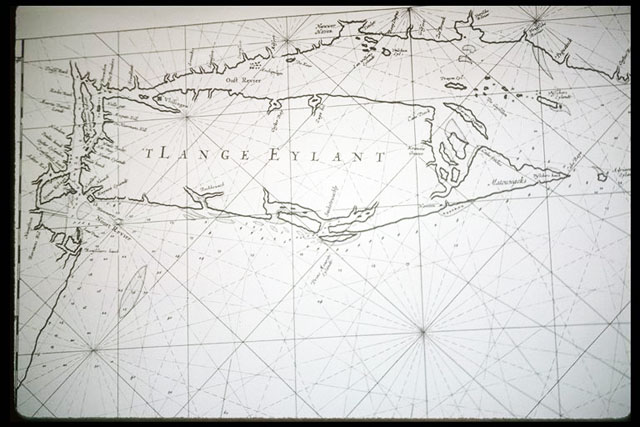
The remarkable Roggeveen chart covers all of Long Island, along with New York Harbor and the Coast of Connecticut. The section of the chart dealing with New York Harbor and western Long Island resembles the more detailed of the two Goos charts, although the maps are not identical. The Roggeveen chart is most notable for its unusual (and very strange) depiction of eastern Long Island. As can be seen in the illustration, the shape the island is very distorted. It seems that there is almost a backwards evolution in the overall depiction of the shape of Long Island on seventeenth-century Dutch maps of New Netherland. The Block Chart and the Blaeu map (which was derived from the Block Chart) do a fairly good job of capturing the overall shape of the island. The Jansoon-Visscher map and the charts by Donckers and Goos are somewhat less successful at presenting the shape of Long Island, although they do show more details and contain many more names than the earlier maps. Some of the nautical charts published at the end of the seventeenth century verge on the bizarre. Part of the explanation for this lies in the difficulty of mapping a large island from the water using the technology of the age. Distances had to be calculated from the speed of a ship, which was usually estimated or, at best, measured by throwing a piece of wood into the water (known as a chip log). Such a method of measuring speed and distance could easily be thrown off by offshore currents, of which there are many around Long Island. The method worked fairly well on a straight reach, such as along either the north or the south shores of Long Island. Hence approximate distances on early maps between landmarks on such stretches can usually be relied on. But the offshore currents could wreck havoc with the charting activities of any ship that circumnavigated the island. Consequently, the overall shape of Long Island and the alignment of opposing coasts were often distorted. The situation was not helped by these maps being engraved in Holland, which made it difficult for publishers to check on the accuracy of their information.
In the case of the Roggeveen chart, Long Island is somewhat stylized and compressed, making it appear a bit too thick. The most dramatic error is that Peconic Bay, which on some earlier maps is tilted considerably too far to the north, is now rotated to an almost north-south direction, instead of being properly oriented east-west. As a result, there was no place for the North Fork, which completely disappears from the map. To find room for Southold (“Zuyt Hol”), Roggeveen moved it westward along the North Shore to an embayment, which is unnamed on earlier maps, and probably originally represented modern Huntington Bay or Port Jefferson Harbor. In addition, the East End of Long Island has several place names, which appear on no other printed maps, and seem to be derived from Spanish or Portuguese sources. These are “Cabo Baya,” “Cabo Sinhoes,” and “Cabo Peeck.” These names seem to be in accord with Koemen’s observation that Roggeeveen used Spanish and Portuguese maps, which he could have found in the archives of the West India Company.
In spite of its peculiarities, the Roggeveen chart contains some information about central and eastern Long Island that cannot be found on previous maps. It includes soundings along the South Shore of Long Island, and for the first time provides considerable hints of shoals and the barrier beach in that area. Roggeveen also delineated the strategic neck of land at Canoe Place on the South Fork (where the Shinnecock Canal is now located). Another interesting and distinctive feature on the Roggeveen chart is the depiction of the area on the South Shore around “Suketewachly” (the Sickete Wachly of the Jansson-Visscher map). Here are several clues to both the nature of SicketeWachly and to one of the sources Roggeveen used to compile his chart. Note the name “Prinz Mouritz Eylandt” given to one of the fragments of the barrier beach. This island must have been named after the Prince Maurice, a Dutch ship bringing settlers to New Amsterdam that was wrecked off the South Shore in 1657—one of the more dramatic and well-documented events in the history of New Netherland. Briefly told, the ship foundered off Fire Island and its passengers were cast upon the barrier beach in late winter. Nearby Indians brought word about the plight of the emigrants to Manhattan, and Peter Stuyvesant himself directed a small fleet of boats that saved all of the passengers and much of the cargo. These events were described in reports sent back to the Netherlands, some of which survived to be translated and published.
The section of the Roggeveen chart depicting the area around Sickete Wachly is clearly based on information about the wreck of the Prince Maurice. Read in conjunction with the surviving Dutch documents, the chart sheds considerable light on the identity of Sickete Wachly. Judging from the nature of the rescue mission, the wreck must have taken place far from the Dutch settlements on western Long Island, but well short of the English at Southampton. This is consistent with the representation on the Roggeveen chart. It is also clear, both from the map and the written sources, that there was a break in the barrier beach and a river at Sickete Wachly. This break could not have been Fire Island inlet, which is too far to the west to be the one shown on this map. Thus it seems likely that the river at Sickete Wachly was either the Carmans or the Connetquot. Given the configuration of the river on the chart (and the apparent depiction of a second river to the west), it is almost certainly the Carmans River. The inlet would then have been in the general area of Smith Point on Fire Island National Seashore. This is an unstable area of the barrier beach, and at least two inlets existed there between 1750 and 1830. This location agrees with that of “Sickete Wachly” on the Jansson-Visscher map, which also shows an Indian village located nearby. The presence of small settlements of Indians (ancestors of the Poospatucks) near the Carmans River is well documented, and this agrees with contemporary reports that the stranded settlers were helped by local Indians.
The last in this sequence of nautical charts was drawn by Claes Janszoon Vooght, and published by his partner Johannis van Keulen in 1685. It bears the title Pas-Kaart Vande Zee Kusten van Niew Nederland Anders Genammt Niew York (Chart of the Sea Coasts of New Netherland, Also Called New York).[35] As the title reveals, Dutch mapmakers showed an understandable reluctance to acknowledge the finality of the English conquest of New York.
This handsome chart combines on one sheet three separate maps: a chart of the Hudson River, a chart of the Connecticut River; and a chart of the area around Long Island and New York Harbor. The part depicting the Hudson River is apparently the first published chart of that river. It does a fairly good job of showing the bends and islands in the river, along with some shoals, but it lacks soundings and is overall much less detailed than the previously discussed manuscript chart drawn around 1630. Many villages inhabited by Native Americans are shown along the river, making the map potentially useful for tracing shifting Indian settlement patterns.
Vooght’s depiction of Long Island is another partially failed attempt to grapple with the island’s illusive shape. This part of the chart is clearly modeled on the Roggeveen chart, but manages to correct some of its most conspicuous errors. Peconic Bay is given its proper east-west orientation, the North Fork and “Zuyd Hol” are restored to their proper places, and the strange Latinate names on eastern Long Island are removed. However, Peconic Bay is too small, the North Fork is dwarfed, and the South Fork shows symptoms of elephantiasis. Overall, the shape of Long Island is even more compressed than on the Roggeveen chart, making it look exceptionally obese. In spite of these failings, Vooght’s chart manages to capture some shapes, such as that of the North Fork, better than previous charts, and adds a few new names, including “Zuyd Hampton” (Southampton). It also provides much more extensive soundings than its predecessors, and does a better job of depicting shoals.Relatively few maps of New Netherland tell us much about what the Dutch actually did with the land. With the partial exception of the maps in the Jansson-Visscher series, the regional overview maps provide us mostly with such information as the locations of rivers, towns, Indian tribes, and fortifications; but they do not include land boundaries or other property information. In this respect, as we shall see, they differ from many of their Anglo-American counterparts. Moreover, the Dutch produced only a handful of specialized cadastral maps, which show such things as property boundaries, the layout of cities and settlements, or the location of buildings.
There are a number of reasons for this dearth of property maps. It should be remembered that many maps have been lost, and there are references in written documents to maps that have disappeared.[36] Also the low population of New Netherland has to be taken into account. Even at the end of the Dutch period, there were only a few small settlements beyond the immediate vicinity of New Amsterdam and the area around Fort Orange and Beverwijk (later Albany). People sometimes inquire about Dutch “patroonship maps,” forgetting that Rensselaerwijk was the only patroonship that actually succeeded and survived the Dutch period. Several other patroonships were created, but they failed to attract settlers, or were destroyed in the Indian wars that plagued the colony. In comparison with the tiny population, land was so plentiful that farms could be allocated without paying much attention to the formalities of surveying, mapping, and registering the land. Indeed, prior to 1638, colonists were allowed to simply “choose and take possession of as much land as they [could] properly cultivate.It has been estimated that at the end of Dutch period there were only about 350 farms in present in modern New York State, excluding the English settlements on eastern Long Island.
Finally, there may be cultural reasons behind the Dutch disinclination to produce property maps. These have been presented by historian Donna Merwick in Possessing Albany. The leaders of the West India Company and New Netherland were mostly merchants or their employees. With a few exceptions, most notably Killian van Rensselaer, they had little or no interest in building large landed estates in the New World. They were also not able to attract large numbers of settlers interested in becoming farmers. The inhabitants of New Netherland included a fair number of outcasts who could not find a place in European society, along with company employees, and those interested in making quick money in the fur trade; but the mix of settlers included few would-be yeomen or freeholders. Unlike the Anglo-Americans, the Dutch settlers of all social groups were not obsessed with improving their status by gaining land. Their aim was to make money, preferably lots of it, and without too much work.
In spite of these constraints, the Dutch did a good deal of land surveying, especially in the last ten years of their occupation of New Netherland. From1642 onward, there was a succession of officials occupying a position comparable to the position of Surveyor General in English colonies. The texts of many Dutch land patents have survived, but, remarkably, it appears that not a single one of these surveys was accompanied by a map. Perhaps, as Merwick has suggested, property was seen as something so personal that it was considered an invasion of privacy to be forced make one’s property holdings publicly known, much less to produce maps of them. However, Merwick’s thesis seems questionable, since the Dutch were quite as capable of surveying and producing cadastral maps as the English, and did so extensively in some of their colonies, especially Brazil. In Virginia (unlike New England) the English also did not do much detailed property mapping until the end of the seventeenth century. Even after 1664 in New York, as will be seen, it was many decades before land patents were routinely accompanied by maps. Thus, I am inclined to think that the exigencies of time and place, rather than the mysteries of the Dutch psyche, are primarily responsible for the small number of property maps from New Netherland.
New Amsterdam is the only city or town in New Netherland for which maps from the Dutch period still exist that show individual buildings or property boundaries. Although these materials have been analyzed extensively by Stokes and others, it is worth reviewing them quickly here for the light they shed on Dutch mapping practices in New Netherland. In this context, it is not altogether clear what to count as a map. Several of the earliest images of the city are usually described as “views” rather than maps—they are drawings showing the city from a particular vantage point, rather than schematic representations drawn to scale. But the distinction between maps and views is not clear cut—especially when one is dealing with seventeenth-century Dutch maps. Inset views of New Amsterdam were frequently included in Dutch maps of New Netherland, and several maps of specific areas within the colony have many of the characteristics of bird’s-eye views. Generally speaking, the more “map-like” views resemble photographs taken from a high elevation, whereas ordinary city views are taken from ground level or a modest elevation. The pictorial quality of many Dutch maps reflects the influence of Dutch landscape painting, which sometimes shows the countryside from a high aerial perspective. It is worth noting that seventeenth-century Holland produced a number of artist-cartographers, including Johannes Vingboons, whose studio produced maps, perspective water colors, and full-fledged landscape oil paintings—often of the same scene.
The earliest view or map of New Amsterdam fits into this hybrid category. This is T’Fort Nieuw Amsterdam op de Manhatans (known as the Hartgers View), which shows the city as it existed around 1626. Although this view was not published until 1651, the printed version is almost certainly a copy of a drawing made by Crijn Fredricx (or Frederycs) between 1626-28.[45] Fredricx was the military engineer who built the first fort at New Amsterdam. He returned to the Netherlands after a brief stay in the New World, and went on to pursue a distinguished career as military engineer and mapmaker in his native country, where he was known by his proper name, Quirijn Fredericksz van Lobbrecht.
The Hartger’s View functions very much like a map in that it shows us the buildings and fortress of New Amsterdam from a sufficiently high perspective to give a clear picture of the layout of the embryonic city and the appearance of its surroundings. The impressive fortress that dominates the city is the one Friedricz wanted to build, rather than the more modest structure that was actually constructed. The engraving also shows some Indians in canoes. They may look familiar, since they are a reversed image of an illustration that later appeared on both the Blaeu and the Jansson-Visscher maps. Friedricz was also sent out with detailed instructions from the Board of Directors of the West India Company on how to lay out lots for farms and buildings in the new city. With some alterations necessitated by the topography of Manhattan Island, these plans formed the basis for the layout of the oldest part of New York City.
Later views give us a good idea of the development of New Amsterdam, although they are drawn from a perspective closer to ground level, which makes them less “map like” than the first view. The best- known view of New Amsterdam is the one that was first published in the Visscher edition of the Jansson-Visscher map, which is usually dated ca. 1655, but which probably dates from 1650 or 1651. This view bears the title Nieuw Amsterdam op t Eylant Manhattans. Only recently has the remarkable history of this view come to light. The original version was drawn for Adrian Van der Donck—most likely by Augustin Herman, who probably also drafted the manuscript used as the basis for the Jansson-Visscher maps. The original of this view makes New Amsterdam look like it is falling apart. The houses are ramshackle, the walls and fort appear to be melting into the ground, no people can be seen, and the windmill has only two arms. This view was apparently intended along with the map to illustrate Van der Donck’s “Remonstrance” to the Dutch West India Company, indicting Stuyvesant’s alleged misadministration. Once this view had served its purpose, it was polished up to serve other purposes. Johannes Vingboons, who worked for the West India Company, made a beautiful watercolor based on this view, in which the fort is repaired, the city is populated, and the windmill is provided with a full complement of arms.[46]Johannes Blaeu also made an engraving of the view, which was similar to the Vingboons drawing, and which was then re-engraved for the 1655 Visscher map of New Netherland. This pattern of reworking maps and views for different purposes and users was not unusual in seventeenth-century Holland, and serves as a reminder of the extent to which maps are often anything but “objective” representations of reality.
The final view of Dutch Manhattan is the so-called “Restitutio view,” which appeared in some editions of the Jansson-Visscher map published after 1673 to celebrate the brief Dutch recapture of the city. This view bears the title Niuw-Amsterdam onlangs Nieuw Jorck genaemt en nu hernomen bij de Nederlanders op den 24 Aug 1673 (New Amsterdam erstwhile called New York and retaken by the Netherlanders on August 24, 1673). The rapid growth of the city in the previous thirty years is evident in this view.
The most detailed and impressive plan of New Amsterdam was produced by Jacques Corteljou, the last surveyor general of New Netherland. It will be discussed below along with other works by Corteljou. No maps showing street plans or buildings of cities in New Netherland other than New Amsterdam have come down to us from the Dutch period. This is mainly because the other settlements were so small that they scarcely needed to be mapped. The only other settlement with more than a few buildings is the town that later became Albany, which grew out of a group of houses huddled around Fort Orange. The settlement was only separated from Rensselaerswyck and formally organized as a town in 1652, when Stuyvesant gave it the very appropriate name of Beverwijck (Beaver-town). The town was informally known to its residents as “the Fuyck.” This name, which comes across to Anglophones as singularly inelegant, means “animal trap,” and refers to the unusual funnel-like shape of the town within its walls, which resembles the converging stockades sometimes used to drive large animals towards hunters (see Figure 4.2 in Chapter 4 of this book) . There were, however, two maps that showed property ownership in larger geographic areas.
For a birds-eye view that more closely resembles a map, let us turn to the view of the colony of Rensselaerswyck drawn for Kiliaen van Rensselaer around 1630 (Figure 2.7).[47] Van Rensselaer had purchased this land in 1630, and the map was made to give him and his associates a picture of their new holdings along the Hudson River near Albany. Most of the surveying for the map was done on the spot by Bastiaen Janz Krol. Recent research has shown that the map was drafted in Amsterdam by Gillis Van Schendel, who was paid six rixdollars by van Rensselaer to produce a map on vellum with four additional copies on paper.[48] The carefully drawn vellum map is now in the New York State Archives. It provides us with an unusually detailed view of the islands in the Hudson River, and of the topography of the east bank of the river, where van Rensselaer wanted to locate his colonists. It also shows several farms which van Rensselaer was in the process of establishing, and also fortified villages of the Mohican Indians. The map needs to be interpreted with particular caution. All maps present selective views of reality, but this one is particularly selective. As Merwick puts it: “First, it was what van Rensselaer wanted to see, modified by what he wanted others, especially his partner Johannes de Laet, to see. Second, it was what the overseas surveyors and draftsmen wanted van Rensselaer to see.”[49] Among other things, it contains odd omissions in the area of the Mohawk River, and accentuates the desirability of the lands along the east side of the Hudson River for settlement.
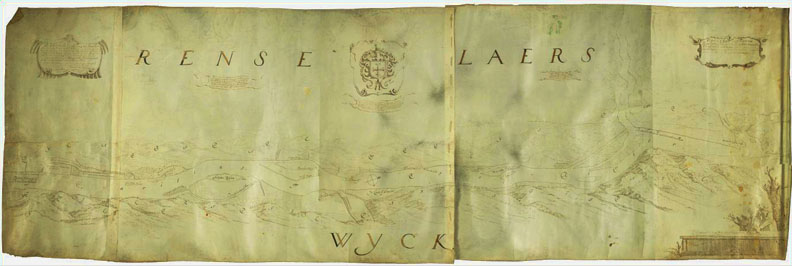
[GilisVan Scheyndel, ?], Renselaerswyck, [ca. 1632]. New York State Archives.
This same pictorial “birds-eye” quality is also evident on the well-known “Manatus” map (Figure 2.8).[50] This manuscript map, which exists in three variant copies, is dated 1639, and was probably made for the West India Company. The author of the original map is unknown, but the copies were very likely made by the studio of Johanness Vingboons. As previously noted, Vingboons maintained a kind of “picture archive” of maps, which he used to produce everything from simple copies to elaborate oil paintings. This type of high-altitude aerial perspective watercolor is a characteristic production of the Vingboons studio, and it is quite possible that he modified a simpler sketch to give it more artistic appeal.
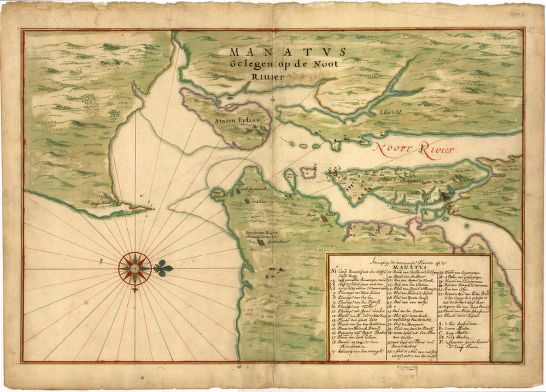
Joan Vinckeboons, Manatvs gelegen op de Noot [sic] Riuier (1639?). Library of Congress, Geography and Map Division.
The original Manatus map was clearly created as an administrative tool for the West India Company. Its chief purpose seems to have been to provide the directors of the company with information about the Dutch settlements; attracting new settlers was possibly a secondary purpose. New Amsterdam itself is not shown in detail, although the Dutch fort at the foot of Manhattan is depicted, along with two windmills. The map focuses on farms in the vicinity of Manhattan, and the names of landowners are provided. In a few cases, property boundaries are also indicated by dotted lines. Several of the farms are shown with associated hayricks, which resemble belfries. These may provide a clue to the meaning of the symbols associated with some of the farms shown on the Jansson-Visscher maps. Several Indian villages are shown on Long Island, and are symbolized by drawings of long houses. Not to be overlooked is the presence of a slave camp on Manhattan Island. Labeled with the letter “F,” it is located opposite present-day Blackwell’s Island. The legend reads in translation “Quarter of the blacks, the Company’s slaves.” A more detailed analysis of the Manatus map can be found in Stokes, who describes almost everything he knew about every feature on the map.
During the final years of Dutch occupation, property mapping became more prominent. As previously noted, the first Dutch Surveyor-General (Andries Huddle) was appointed in 1642. The modest surge of population under Peter Stuyvesant after 1644 prompted an increase in land ownership and surveying. We know enough about the personality and activities of the last Surveyor-General of New Netherland (or Sworn Surveyor as he was called by the Dutch) to gain some insight into the life of a surveyor towards the end of the Dutch period. His name was Jacques Corteljou. He was a French-speaking Fleming, who arrived in New Netherland in 1652, and was appointed to his office in 1657. Corteljou continued as Surveyor General until 1671, several years after New Netherland passed into the hands of the English. He continued to make his living as a farmer on Long Island and as a surveyor until his death in 1692 or 1693. He was one of the founders of New Utrecht (now part of Brooklyn), and had seven children, one of whom, Pieter Corteljou (ca. 1665 –1757), was also a professional surveyor. Both names appear frequently in New York colonial land records.
Some intriguing comments on Jaques Corteljou’s life and character have come down to us from Jaspar Danckaerts, who made a tour of several of the British colonies in search of a place to found a settlement for a religious sect to which he belonged (the Labadists). In 1679, Dankaerts wrote in his journal: “Jaques is a man advanced in years. He was born in Utrecht, but of French parents, as we could readily discover from all his actions, looks and language. He had studied philosophy in his youth, and spoke Latin and good French. He was a mathematician and sworn land-surveyor. He had also formerly learned several sciences, and had some knowledge of medicine. The worst of it was, he was a good Cartesian and not a good Christian, regulating himself, and all externals, by reason and justice only; nevertheless, he regulated all things better by these principles than most people in these parts do, who bear the name of Christians or pious persons.” [53]Rationalists and religious skeptics were not common anywhere in the middle of the seventeenth century, and Corteljou would have been one of very few in North America at the time. His background in mathematics and science would have served him well as a surveyor; it was not uncommon prior to the twentieth century for surveyors to have wide-ranging scientific interests.
We also know something about Jaques Corteljou’s activities as a land surveyor. A number of his property surveys are recorded in the state Land Papers.[54]. None of the surveys he made during the Dutch period were accompanied by maps, although a sketch map appears in one of his later surveys. Toward the end of the Dutch period, he was also involved in surveying cities and new settlements. In 1664 he was sent by Stuyvesant to survey for a land patent the small settlement that had grown up at Schenectady. It was not until 1684 that an actual patent for Schenectady was granted by the English.
Corteljou’s most important achievement is a detailed map of New Amsterdam, which is preserved in a copy known as the Castello Plan. Corteljou is reported to have conducted four surveys of New Amsterdam between 1657 and 1661. The Castello Plan, which was made around 1665-68, is thought to be a copy of his 1660 map. It is contained in an atlas of manuscript maps that includes one of the copies of the Manatus map, and other maps similar to those in the Harrisse collection. It is therefore likely that this copy comes from the studio of Johannes Vingboons. The Castello Plan is quite detailed. It is carefully drawn to scale, and shows streets and fortifications, along with individual houses and lots. It was declared by Stokes to be “the most complete and accurate of any map of any city in the New World north of Mexico, at that Period, not excepting French and Spanish maps.” One of the most important maps in the history of New York City, it also has been described extensively elsewhere Dutch mapping of present-day New York did not come to an end in 1664. Not only was there a brief restoration of Dutch rule in 1673-74, but the province of New York remained predominantly Dutch well into the eighteenth century, and Dutch influences continue to the present. The area continued to maintain trading relations with Holland, and Dutch map makers continued to produce maps of New Netherland. After about 1680, most of the maps of New York published in the Netherlands were reprints, or were based on English sources. It was many years before Dutch publishers could bring themselves to remove the name “Nieu Nederlandt” from their maps of the New York area.
Students of New Netherland should not neglect to study some of the maps made during the English period, which often throw light on earlier conditions. This particularly applies to property maps. As will be seen, the English were generally much more meticulous than the Dutch about surveying and recording property boundaries. Consequently, in order to defend and maintain their holdings, Dutch landowners in the English period often had to commission surveys of their properties. These were frequently made by Dutch surveyors and written in Dutch. Some of them reveal characteristic features of Dutch map making, and they are useful for such purposes as studying patterns of Dutch Settlement.
Although there are no maps from the Dutch period for cities other than New Amsterdam, this lack is partially remedied by maps that were produced by English surveyors towards the end of the seventeenth century. Albany, Schenectady, and Esopus (Kingstown) were mapped by Wolfgang Römer and John Miller. These maps, which show characteristic Dutch settlement patterns, will be discussed in Chapter 4.
Finally, it should be noted that Amsterdam financiers did not entirely lose interest in New York after 1664. In the first part of the nineteenth century, a group of Dutch investors, much like those who stood behind the West India Company, created the Holland Land Company. As we will see, the Holland Land Company played a major role in the settlement of western New York, and was much more profitable for its backers than the Dutch West India Company ever was. One of its legacies is the city of Buffalo, which was the second city in New York State to start its career under the name of New Amsterdam.